
HOW TO READ A STUDY
The reliability of mainstream studies has been called into question in recent times. The assumption that “science is always right” is a fallacy since scientific opinion is ever-changing. Additionally, most people do not read the entire study they are citing, and they may not be aware of who funded the research and why. This can lead to unintentional referencing of biased or manipulated research, either due to incompetence or intentional actions.
Many of the so-called “evidence-based experts/gurus” have been promoting the COVID-19 vaccine despite the absence of clear evidence regarding its clinical safety, efficacy, and concerning side effects. This serves as an alarming example of the potentially dangerous consequences of trusting biased or incomplete research.
There are instances where medical professionals may prioritize financial gain over the well-being of their patients by misdiagnosing conditions, prescribing ineffective or harmful medications, and creating long-term damage that leads to more problems. This approach perpetuates a cycle of generating revenue rather than prioritizing patient care.
This guide aims to provide a basic understanding on how to approach, scrutinize, and interpret a study. By following the tips and guidelines provided, you will be able to make informed decisions when referencing research and avoid unintentionally relying on biased or manipulated information.
Table of Contents
- Why Learn to Read a Scientific Study?
- Types of Studies
- Understanding the Abstract & Introduction
- Methods: The Most Important Part of the Study
- Demographics
- Design & Endpoints
- Interpreting The Statistics
- P-values 101
- Don’t Blindly Rely on P-values
- Reading the Results
- Clarifying the Conclusion
- Conflicts of Interest
- Digging Down to the Truth
- Basic Checklist
Why Learn to Read a Scientific Study?
Marketing claims backed by “scientific evidence” are prevalent in the health and fitness industry. Manufacturers of supplements often sell products based on limited human research, presenting them as having the same level of established effectiveness as extensively researched compounds such as creatine. However, not all studies hold equal value, and following a marketing claim’s paper trail may not necessarily lead to a published study. To avoid spending money on ineffective products, you must be able to evaluate a study’s credibility, applicability, and clinical significance. To fully comprehend a study’s implications, including how it relates to previous research on the subject, you must read beyond the abstract. Context plays a crucial role in interpreting new research, which is why abstracts can be misleading.
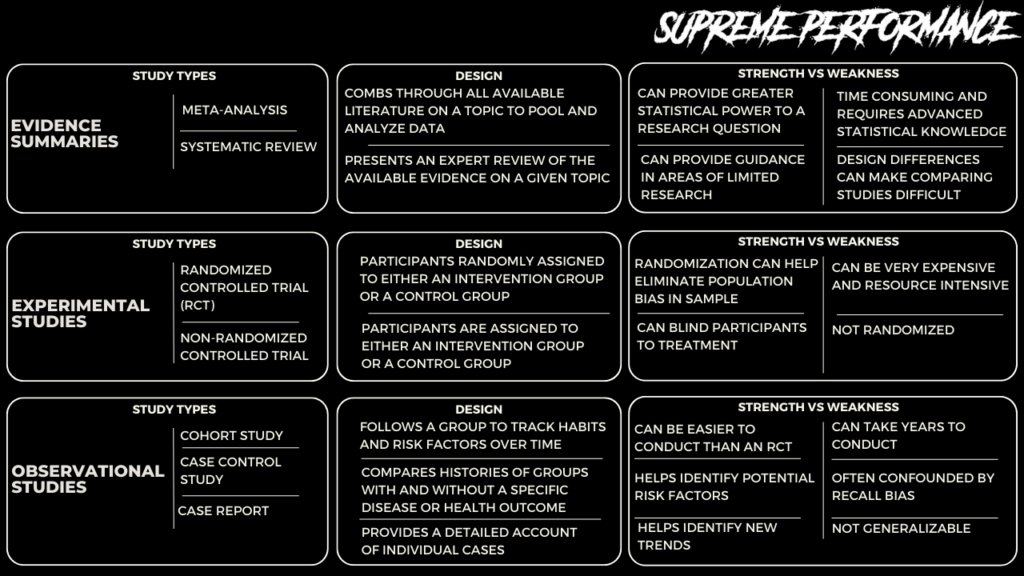
Types of Studies
Randomized, double-blind, placebo-controlled trials are widely regarded as the highest standard for biomedical research. Such trials involve randomly assigning participants to either an intervention group, which receives the treatment, or a control group, which receives a placebo. Neither the participants nor the researchers conducting the experiment know which group a participant belongs to, ensuring impartiality.
Understanding the Abstract & Introduction
When reading a research paper, it is important to understand its structure and limitations. Typically, a paper consists of sections such as an abstract, introduction, methods, and conclusion. The abstract provides a brief summary of the study, but it may not provide sufficient context to determine the study’s applicability in real-world situations. Therefore, it is crucial to read the entire paper before citing it as evidence.
The introduction sets the stage by clearly identifying the research question and summarizing previous relevant research. It can also serve as a good starting point for finding additional reading material. Reading several studies on a given topic provides more data and a better understanding of the subject.
One study is just one piece of the puzzle.
Examining multiple studies on a particular topic can yield valuable insights, even if you lack the expertise to conduct a meta-analysis. For instance, suppose you only read one study that investigated the impact of creatine on testosterone and discovered a rise. In that case, all your data implies that creatine increases testosterone. However, if you review ten studies on the effect of creatine on testosterone and only one demonstrates an increase, then 90% of your data suggest that creatine does not boost testosterone levels. It’s worth noting that meta-analyses are much more complex than simply comparing the number of studies that produce a positive or negative result; they must also consider study design, sample size, and bias.
It’s not surprising that supplement companies cherry-pick studies to support their claims. They may only mention the one study that demonstrates an increase in testosterone if they’re selling creatine as a testosterone booster, ignoring the nine that indicate no increase. Similarly, opposing sides in a debate may select studies to “prove” their point. If you’re seeking evidence for or against a particular topic, you can find a study to support either view. To uncover the truth, it’s necessary to examine the whole body of evidence, including studies that don’t necessarily align with your initial perspective.
It’s important to keep in mind that researchers may also cherry-pick studies, and a contentious area may only mention studies that support the author’s conclusions. To ensure that you have a well-rounded view, it’s a good idea to seek other papers on the topic, particularly when you know that the field is contentious.
Methods: The Most Important Part of the Study
The section of a research paper labeled “Methods” or “Materials and Methods” is a crucial component as it outlines the study’s design and details about its participants. The goal is to make this section clear and comprehensive so that other researchers can replicate the study without the need to contact the original authors. To fully comprehend the study’s results, it is essential to assess the strengths and limitations outlined in the Methods section.
Demographics
The “Methods” section typically begins with information on the study’s participants, including age, sex, lifestyle, health status, and recruitment method. This information is vital in determining the relevance of the study to you, your loved ones, or your clients.
Although demographic information can be extensive, it should not be overlooked as it affects both the reliability and applicability of the study.
Reliability refers to the degree to which the study’s results are dependable, with larger sample sizes providing greater reliability. It is worth noting that studies usually begin with more participants than they end with, and some studies, particularly those related to diet, experience a significant number of dropouts.
Applicability is an important factor in health and fitness research as it acknowledges that a particular compound or intervention, such as exercise, diet, or supplements, that works well for one person may be ineffective or even harmful for another. For example, although creatine is generally considered safe and beneficial, some individuals may not respond to this supplement, and it may not enhance their exercise performance.
The demographic information provided in a study’s “Methods” section is crucial for assessing the study’s applicability and reliability. A trial’s applicability refers to how useful an intervention or compound is for a specific group of people, while its reliability depends on the number of participants involved in the study.
It is important to consider how the study’s demographics might affect its applicability. For example, if a study only includes men, its results may be less applicable to women. The recruiting methods used by the researchers can also influence the demographics of the study population. Trials that use “random sampling” are generally more applicable to the general population, whereas “convenience sampling” may only attract certain demographics.
The study’s demographic information can also reveal if any participants were excluded from the study, and if so, why. This is often due to the presence of a confounding variable, which can influence the results. For example, if a study investigates the effects of a resistance training program on muscle mass, the researchers wouldn’t want some participants to take muscle-building supplements while others don’t. This would create a confounding variable that could influence the results.
Similarly, if a study investigates the effects of a muscle-building supplement on muscle mass, some participants shouldn’t exercise while others do not. Once again, this creates a confounding variable. While it’s possible for studies to have more than two groups, this increases the number of participants required, making the study more difficult and expensive to run.
Essentially, any differences among study participants could be a confounder and impact the results of the study. Therefore, trials with mice use specimens with similar genetics, and trials in humans typically have a restricted sample size to eliminate potential confounders such as age and sex.
If a study has a large enough sample size, more groups can be created even after the study is completed through a subgroup analysis. For example, the data for males and females in a study on the effects of red meat can be separated and analyzed independently. However, subgroup analyses are exploratory rather than confirmatory and can result in false positives. False positives are like when a blood test wrongly detects a disease.
Design & Endpoints
The “Methods” section provides information on the design of the study, which can include various variants such as single-blind trials or observational studies. It also gives details about the study’s duration, dosages used, workout regimen, testing methods, and more. Ideally, this information should be specific and detailed enough for other researchers to replicate the study without contacting the authors.
Moreover, the “Methods” section outlines the endpoints the researchers will be evaluating, with the primary endpoint being the main criterion to judge the study’s outcome. Secondary endpoints can also be included. However, some studies collect many endpoints to find an effect, and then focus only on those endpoints in their paper that showed an effect. This practice, called “data dredging/fishing,” is a problem because it can lead to false positives. To prevent this, scientists advocate for preregistration of studies.
To evaluate published studies accurately, one must develop skills to recognize tricks used by less scrupulous authors, such as data dredging/fishing.
Interpreting The Statistics
The “Methods” section of a study typically ends with a discussion of statistics. It can be overwhelming to determine whether an appropriate statistical analysis was used for a given trial, but focusing on the big picture is key.
Two common misunderstandings should be cleared up. Firstly, an effect can be significant, but also very small. For scientists, “significant” means “statistically significant” – meaning that the data collected during the study would be unlikely if there was no effect. Secondly, “no effect” usually means “no statistically significant effect.” In some cases, there may have been changes, but they were not significant, meaning that they could be due to random fluctuations.
The larger the sample size of a study, the more reliable its results. Additionally, the larger the sample size, the more likely it is to find small effects that are significant. For example, a meta-analysis can pool data from several studies that found no significant changes on their own, but when combined, reveal significant changes.
P-values 101
In scientific studies, an effect is typically considered significant if the statistical analysis yields a p-value that is below a certain threshold predetermined by the researchers. This threshold is known as the threshold of significance.
However, interpreting p-values can be challenging even for experts in the field. To understand what a p-value means, consider a simple example of flipping a coin. If you flip a coin 100 times, it’s expected that you will get a roughly equal number of heads and tails. But what if you flip the coin 100 times and get heads every single time? This outcome would be highly surprising, with a probability of occurrence of only 0.00000000000000000000000000008%.
You can think of p-values in terms of getting all heads when flipping a coin.
- A p-value of 5% (p = 0.05) is no more surprising than getting all heads on 4 coin tosses.
- A p-value of 0.5% (p = 0.005) is no more surprising than getting all heads on 8 coin tosses.
- A p-value of 0.05% (p = 0.0005) is no more surprising than getting all heads on 11 coin tosses.
Understanding and interpreting p-values can be difficult, but one way to improve your intuition is to convert them into coin tosses or S-values. This can be done by considering the probability of getting all heads in a series of coin tosses, with a lower probability indicating a smaller p-value. As we saw earlier, an effect is considered significant if the collected data would be unlikely if there was no effect. The lower the p-value (below the threshold of significance), the more confident we can be that the effect is significant.
In most experiments, there are two competing statements: the null hypothesis and the alternative hypothesis. For example, in a hypothetical study comparing the weight-loss supplement “Better Weight” to a placebo, the two opposing statements would be:
- Null hypothesis: compared to placebo, there is no difference in weight change between the group taking Better Weight and the group taking placebo. This means that the supplement has no effect on weight, and any observed difference in weight change between the two groups is due to chance.
- Alternative hypothesis: compared to placebo, Better Weight has an effect, either positive or negative, on weight.
Researchers use statistical analyses to determine whether an intervention, such as a weight-loss supplement has a positive or negative effect on a particular endpoint compared to a control, which could be a placebo or another well-studied intervention. To do this, they set a threshold of significance (α) before the trial and compare the p-value (p) from the results to this threshold (p ≤ α) to see if there is a significant difference between the two treatments. The most commonly used threshold is 5% (α = 0.05), which means that if the null hypothesis is true (i.e., there is no difference between treatments), false positives would occur at most 5% of the time if the experiment were repeated an infinite number of times. In this context, significant means statistically significant.
In general, the p-value measures the agreement between the results of the study and the hypothesis that the effects of the two treatments are equal. To illustrate this, let’s consider our weight-loss trial comparing the hypothetical weight loss supplement to a placebo:
- Scenario 1: The p-value is 0.80 (p = 0.80). This indicates that the results are more consistent with the null hypothesis (i.e., the hypothesis that there is no difference between the two treatments). Based on this, we can conclude that the weight loss supplement did not have a significant effect on weight loss when compared to placebo.
- Scenario 2: The p-value is 0.01 (p = 0.01). The results suggest that there is a difference between the two treatments, which is more consistent with the alternative hypothesis (i.e., the idea that there is a difference between the two treatments). Therefore, we can conclude that the weight loss supplement had a significant effect on weight loss compared to placebo.
Smaller p-values give us greater confidence in the study findings, as they indicate stronger evidence against the null hypothesis. However, comparing p-values between different studies can be difficult and sometimes not valid, as there may be other factors at play. It’s also important to note that a significant effect does not necessarily mean a clinically relevant effect. For example, even if the hypothetical weight loss supplement produces a statistically significant difference in weight loss compared to placebo, the actual weight loss may be too small to have any meaningful impact on health. This is more likely to occur in larger studies, as they have greater power to detect even small effects.
It should be noted that some studies require a higher level of certainty than the commonly used threshold of significance of 5% (p ≤ 0.05). For example, genetic epidemiologists may set the threshold of significance at 0.0000005% (p ≤ 0.000000005) when declaring a genetic association to be statistically significant, such as associating a gene with weight gain. This threshold is equivalent to obtaining 28 consecutive heads in a coin toss and has a probability of occurrence of only 0.00000003%.
Don't Blindly Rely on P-values
Although p-values are important, they should not be the sole determinant of a study’s accuracy. As we discussed earlier, researchers may be tempted to engage in “data fishing” or “p-hacking” in order to achieve statistically significant results, potentially skewing the findings. In addition, p-values can be influenced by a variety of factors beyond the researcher’s control, including study design, hidden confounders, and statistical tests. Therefore, when evaluating a study’s strength, it’s important to put yourself in the researcher’s position and think about how you could manipulate the study to achieve your desired outcome and advance your career.
Reading the Results
To summarize, it is important to carefully read the “Results” or “Results and Discussion” section of a research article, but not before reading the “Methods” section. Rushing to the results section may lead to misunderstandings or misinformation since researchers may give their results a certain spin to make them more interesting. Understanding how researchers arrived at their conclusion is equally important as the conclusion itself.
When examining the “Results” section, one should look for a comparison of characteristics between the tested groups. Significant differences in baseline characteristics may indicate that the two groups are not comparable, which could be due to chance or an incorrect randomization method.
Researchers must also report dropout and compliance rates, as participants may not complete the trial or fail to follow instructions. While it is normal to have some dropouts or noncompliant participants, too many can be a red flag, especially if one group has a higher dropout rate than the others.
Scientists gather data using various methods such as questionnaires and blood panels, and present their findings through charts and graphs. It’s important to pay attention to the scale used on the y-axis of these visuals, as a seemingly significant change may actually be quite minor.
In the “Results” section, researchers may include a secondary analysis such as a subgroup analysis or sensitivity analysis. A subgroup analysis involves analyzing the data for a subset of participants, such as only women or only those over 65 years old. A sensitivity analysis examines how the results change when different analytical methods are used or when certain data points are excluded.
The reliability of a study is heavily influenced by its sample size, as discussed in the “Demographics” section. When excluding participants from the analysis, the sample size decreases and the risk of false positives increases. It’s possible for researchers to manipulate the data to achieve a desired outcome, such as in the hypothetical example of a researcher paid to prove the efficacy of a weight loss supplement. In this example, the researcher could perform a subgroup analysis on only one participant, a woman aged 65, and conclude that the supplement is effective for women aged 65. Therefore, it’s crucial to be aware of the potential for bias and to carefully evaluate the methods used in a study.
Clarifying the Conclusion
The “Discussion” section often contains the authors’ analysis and interpretation of their results, along with their proposed mechanisms of action or explanations for the observed effects. They may compare their findings with previous studies and suggest further research directions. Keep in mind that each study is just one piece of the larger puzzle, and its place within the existing body of evidence is important.
In this section, the authors should also acknowledge the strengths and limitations of their study. It is important to critically evaluate these and determine whether the authors have provided a balanced assessment. If there are any gaps or limitations, it is necessary to identify them.
The conclusion can also provide valuable context and insight, similar to the introduction. It is important to be cautious if the researchers are extrapolating beyond the scope of their study or exaggerating the results. In such cases, it may be necessary to re-read the study, particularly the “Methods” section, to gain a better understanding.
Conflicts of Interest
After the conclusion, it is common to find a disclosure of any conflicts of interest (COIs) that may exist in the study. These arise when the individuals involved in designing, conducting, or analyzing research have an incentive to find certain outcomes. The most obvious source of a COI is financial, such as when a study is sponsored by a company or when one of the authors is employed by an organization that could benefit from the study supporting a specific effect.
Unfortunately, a study has shown that COI nondisclosure is relatively common. Moreover, what one journal considers to be a COI may not be seen as such by another, and some journals may have COIs themselves that they do not disclose. For example, a journal from a country that exports a particular herb may have hidden incentives to publish studies that support the benefits of that herb. Therefore, one cannot assume that a study is free from COIs just because it does not focus on a specific product or that COIs necessarily influence results if they exist. COIs must be evaluated carefully.
Digging Down to the Truth
As mentioned earlier in the “Demographics” section, it is important to note that study results do not necessarily apply to everyone. While researchers may intentionally select a certain demographic to help a specific group of patients, it can also be a way to promote certain results. This is why some studies supporting new “fat burners” may only recruit overweight postmenopausal women. Unfortunately, when this information is not included in the abstract and journalists skip over the “Methods” section or the entire paper, it can lead to misinformation and confusion.
It is important to keep in mind that media outlets may not have read the entire study, so relying solely on their reporting can be misleading. A survey evaluating the quality of dietary advice in UK national newspapers revealed that a significant portion of health claims (between 69% and 72%) were based on inadequate evidence. Journalists, who are often overworked and under tight deadlines, often rely on study press releases which can fail to accurately convey the study’s findings.
Therefore, it is crucial to appraise the study oneself in order to accurately assess its strengths and potential limitations. When in doubt, it is advisable to re-read the study’s “Methods” section.
Basic Checklist
To make it easier for you to read and remember, we’ve put together a checklist for you to follow when you read a nutrition paper. Ask yourself these questions to get a better understanding of the study:
- What was the study trying to answer?
- Did the paper clearly describe the study design?
- What type of study was it?
- How long did it last?
- What were the primary and secondary endpoints?
- Could you reproduce the trial with the information provided?
- Was the trial randomized? If so, how?
- Was the trial blinded? If so, how many times?
- What treatments were given?
- What demographic was studied?
- How many participants were recruited?
- Were the inclusion and exclusion criteria clearly laid out?
- How were the participants recruited?
- What did the analysis show?
- How many dropouts were there in each group?
- Were the results statistically significant?
- Are the results applicable to the real world?
- Were the results clinically relevant?
- Who might the results apply to?
- Were the dosages realistic?
- Were there any side effects or adverse events?
- If so, how severe and frequent were they?
- What were the potential sources of bias?
- Were there unequal dropouts between groups?
- Did the intervention group actually follow the intervention?
- Was the study preregistered?
- Were there any conflicts of interest?